Trade Crypto With an Unfair Advantage
Stop being the gambler. Become the house. Get the daily crypto intelligence you were never meant to see.
To understand the unfair advantage, you first need to understand the game.
🔥 There's a Dark Truth About Crypto Trading Nobody Will Tell You
If you've been trading crypto for any length of time, you've probably had this thought:
"Why does it feel like someone else always knows what's happening before I do?"
You buy — it drops.
You sell — it runs.
You finally build conviction — the market rips the other way.
You wait on the sidelines — and watch the next 20% move leave without you.
It feels like the game is rigged.
Because it is.
Not in a corrupt way…
but in an informational way.
There are two types of participants in this market:
- The Gambler.
- The House.
Most retail traders are gamblers — reacting to the latest candle, the latest narrative, the latest influencer who swears "THIS is the one."
Meanwhile…
The house quietly sits in the corner, studying the structure of the market like a blueprint.
The house isn't reacting.
The house isn't guessing.
The house isn't emotional.
The house wins — because the house sees things no one else sees.
And today…
you're about to cross that line.
🔒 The Unfair Advantage They Never Wanted You to Have
If a crypto hedge fund built what I'm about to show you, you would never see it.
It wouldn't be sold publicly.
It wouldn't be advertised.
It wouldn't be affordable.
It would live behind a $10,000/month research subscription or inside a private Telegram group for institutional clients.
Because when you can SEE what the market is structurally doing — you stop playing the game emotionally.
- You stop guessing.
- You stop being manipulated by the chop.
- You stop buying high.
- You stop selling low.
- You stop chasing candles like a dog chasing cars.
And you start winning the way professionals win:
- Systematically
- Calmly
- With conviction
- With context
- And with clarity
The exact clarity you're about to get with the TradeRanges Crypto Newsletter.
🔧 The Hidden Blueprint That Makes Crypto Finally Make Sense
Crypto looks chaotic when you don't understand the structure underneath it.
But once you see that structure, everything becomes simple — even predictable.
Here's the truth:
Every market is always doing one of two things:
Returning to its home range… or escaping into a trend.
Most traders never recognize which behavior is happening.
They buy at the top.
They sell at the bottom.
They chase fake breakouts.
They panic during normal pullbacks.
Why?
Because they don't understand the range.
Every asset trades inside a natural "home base" — a bottom, a middle, and a top.
Inside that range, mean reversion controls the action:
- bottoms attract buyers
- tops attract sellers
- the middle is noise
But something special happens when the range itself begins to shift.
When BuyBottom prints a higher-low, or SellTop prints a higher-high, the entire regime changes:
Mean reversion fades → Trend takes over.
Compression disappears → Momentum emerges.
Chop ends → Expansion begins.
Retail traders only notice this after the breakout candle.
But by then, the move is already 20% gone.
The Range Position Map shows you this shift as it's happening.
It reveals whether the market is in:
- a reversion regime (buy low, sell high)
- a transition regime (tightening, compression, pre-breakout)
- or a full trend regime (momentum, continuation, expansion)
This isn't a guess.
It's the blueprint.
It's the structure.
And once you can see the structure, you finally understand how to act.
Because each regime tells you exactly what to do next.
And that's where the real power of this system begins…
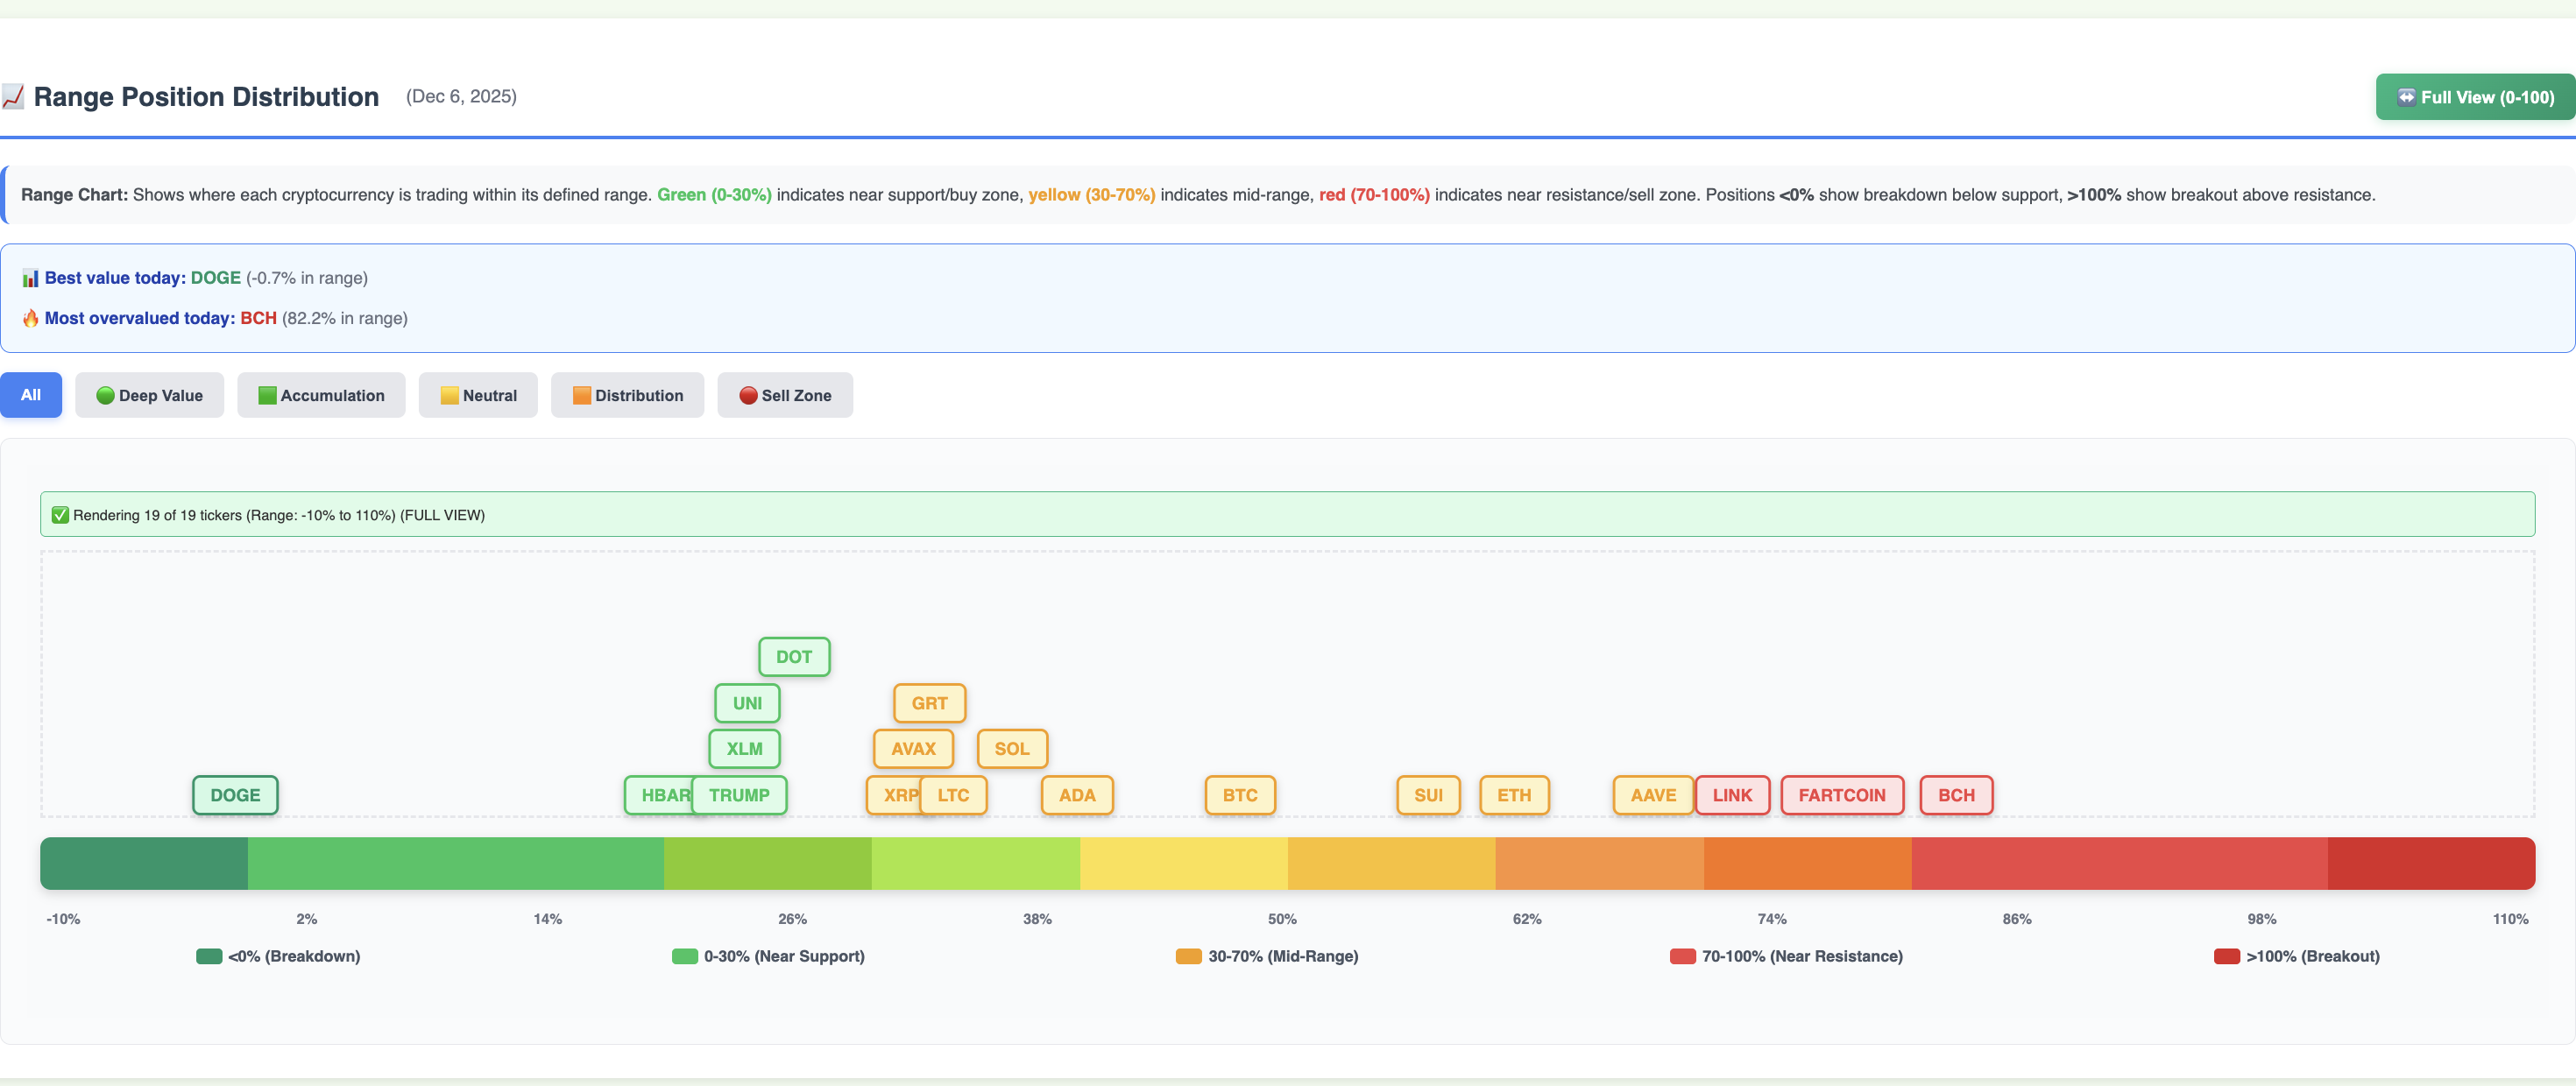
This is the actual Range Position Distribution the newsletter is built on – each coin plotted from breakdown to breakout so you can instantly see who's sitting at bottom range, mid-range, or top range before you make a decision.
🎯 Now You're Ready to Learn How to Use the Tool
Now that you understand the hidden structure behind every price move,
let me show you the exact step-by-step method professionals use —
and how TradeRanges automates it for you every day.
🎲 For the First Time, You Stop Being the Gambler… And Start Becoming the House
You've seen how the market really works — the hidden structure, the regimes, the shifts.
Now here's what happens when you finally have the tools that reveal it.
Imagine having access to the exact same structural intelligence the "house" uses — the kind of data that tells you not just what is happening… but why, where, and what comes next.
Let me show you the five tools that turn chaos into clarity:
🟦 1. Range Position Mapping — The Market's Hidden Blueprint
Every asset in crypto lives inside an invisible structure — a bottom, a middle, and a top.
Most traders never see it. They chase candles, draw random lines, and pray they're buying strength instead of catching a falling knife.
But the market isn't chaotic. It's architectural.
It moves inside ranges… and when you finally see those ranges — really see them — the entire game changes.
Imagine walking into a casino for the first time. Everyone else is making wild bets, sweating bullets, letting emotions run the show…
But you're holding the blueprint of the building.
You know where the walls are. Where the exits are. Where the pressure points are. Where the floor is about to give way.
That's what Range Position Mapping is.
It shows you the structure that price is quietly following: Bottom Range: where mean reversion coils like a spring • Mid Range: the balance point where pressure decides • Top Range: where exhaustion and risk begin • Breakdown Zones: where danger accelerates • Breakout Zones: where momentum takes over • Reversal Zones: where opportunity hides in plain sight
This isn't guesswork. It's the map.
But here's the part that turns this from "useful" to "unfair advantage":
You're not just seeing where price is. You're seeing how the entire range is shifting.
When the lower boundary starts rising — when the upper boundary starts pushing higher — when the structure bends before it snaps — you know something big is forming.
Most traders only notice the move after the breakout. You see the range changing shape before the breakout even exists.
This is the moment where: Trend is born. Momentum ignites. Breakouts are seeded. The exact moment retail always misses.
So instead of asking: "Is this a dip or a disaster?" "Is this pump real or a trap?" "Should I buy? Should I sell?"
You finally ask the only question that matters: Where am I inside the structure?
Bottom → opportunity. Top → caution. Mid → decision. Shifts → momentum.
This is how professionals think. This is how the house plays the game. This is the blueprint behind every move the market makes.
And for the first time… you see it too.
🟧 2. Sentiment Distribution & Forecast — The Market's Emotional Seismograph
Crypto doesn't move because of charts. It moves because of pressure — invisible waves of confidence and fear pulsing beneath every candle.
Most traders never feel those waves. They only see the earthquake after it happens.
But now? You see the tremors before the ground breaks.
Imagine you had a device that didn't look at headlines, influencers, or rumors… but instead felt the heartbeat of every asset — the subtle pushes and pulls that reveal whether buyers or sellers are tightening their grip.
A device that could sense: when confidence is swelling • when fear is silently creeping in • when hesitation is turning into conviction • and when the market is about to breathe — in or out.
That's what this tool is.
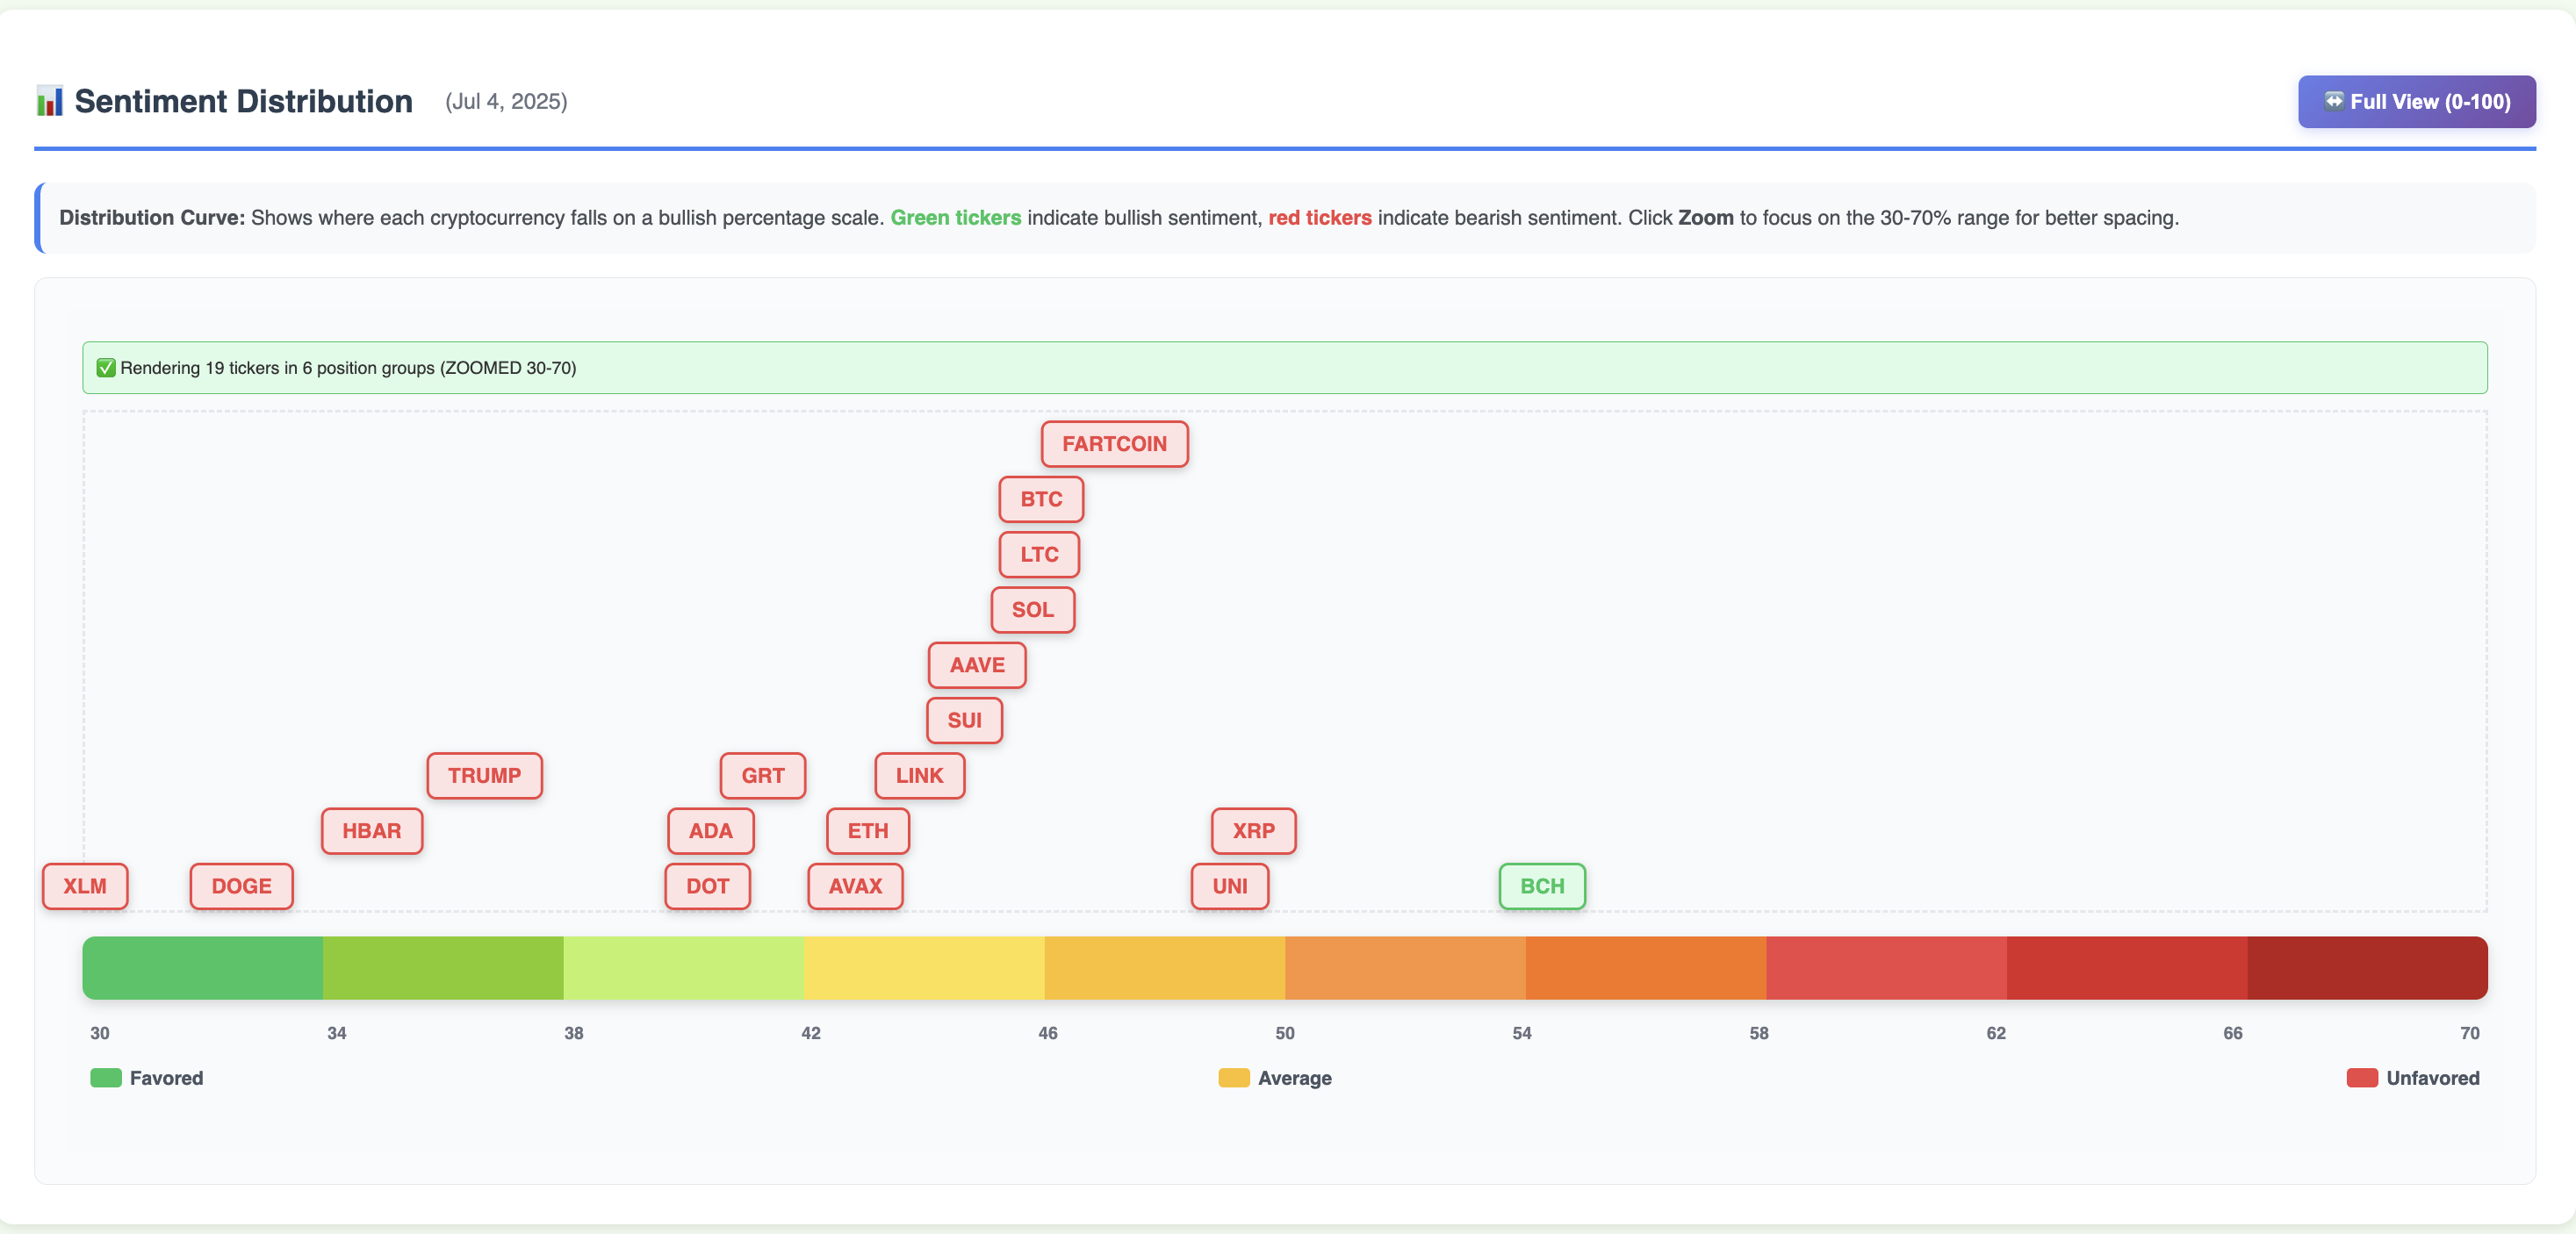
It maps the psychological pressure of the entire crypto universe — 19 major assets — all in one glance.
Instead of staring at candles and guessing, you get a living atlas of the market's emotional state: Green: strength building beneath the surface • Yellow: indecision tightening like a spring • Red: pressure breaking down, momentum weakening
And here's the secret professionals never tell you:
These emotional shifts happen before the price moves. Always.
Retail sees the candle. Professionals feel the pressure. Now you do too.
When sentiment starts turning across the board — before the chart even twitches — you're already ahead of the move.
Breakouts stop surprising you. Sell-offs stop blindsiding you. Chop stops confusing you. FOMO stops controlling you.
Because you're not reacting anymore. You're anticipating.
That's the real edge. And it's the one retail never gets — until now.
🟥 3. Relative Strength Matrix — The Market's Sorting Hat
Every day, crypto lines up like a battlefield.
Some assets are quietly gathering strength. Some are backing away. Some are pretending to be strong but are hollow inside. Some are about to take the lead. Some are about to collapse.
Most traders can't tell the difference.
They see green candles and assume "strength." They see red candles and assume "weakness." They follow noise instead of structure.
But the market doesn't care about noise. It cares about dominance.
And when you measure assets against each other — not in isolation, but head-to-head, strength-to-strength — something magical happens: The truth reveals itself.
Imagine if every coin had to step into a ring every morning… not to fight against price, not to fight against news, but to fight against every other coin.
A pure test of strength. No hype. No illusion. Just: Which asset is actually stronger? Which asset is actually weaker?
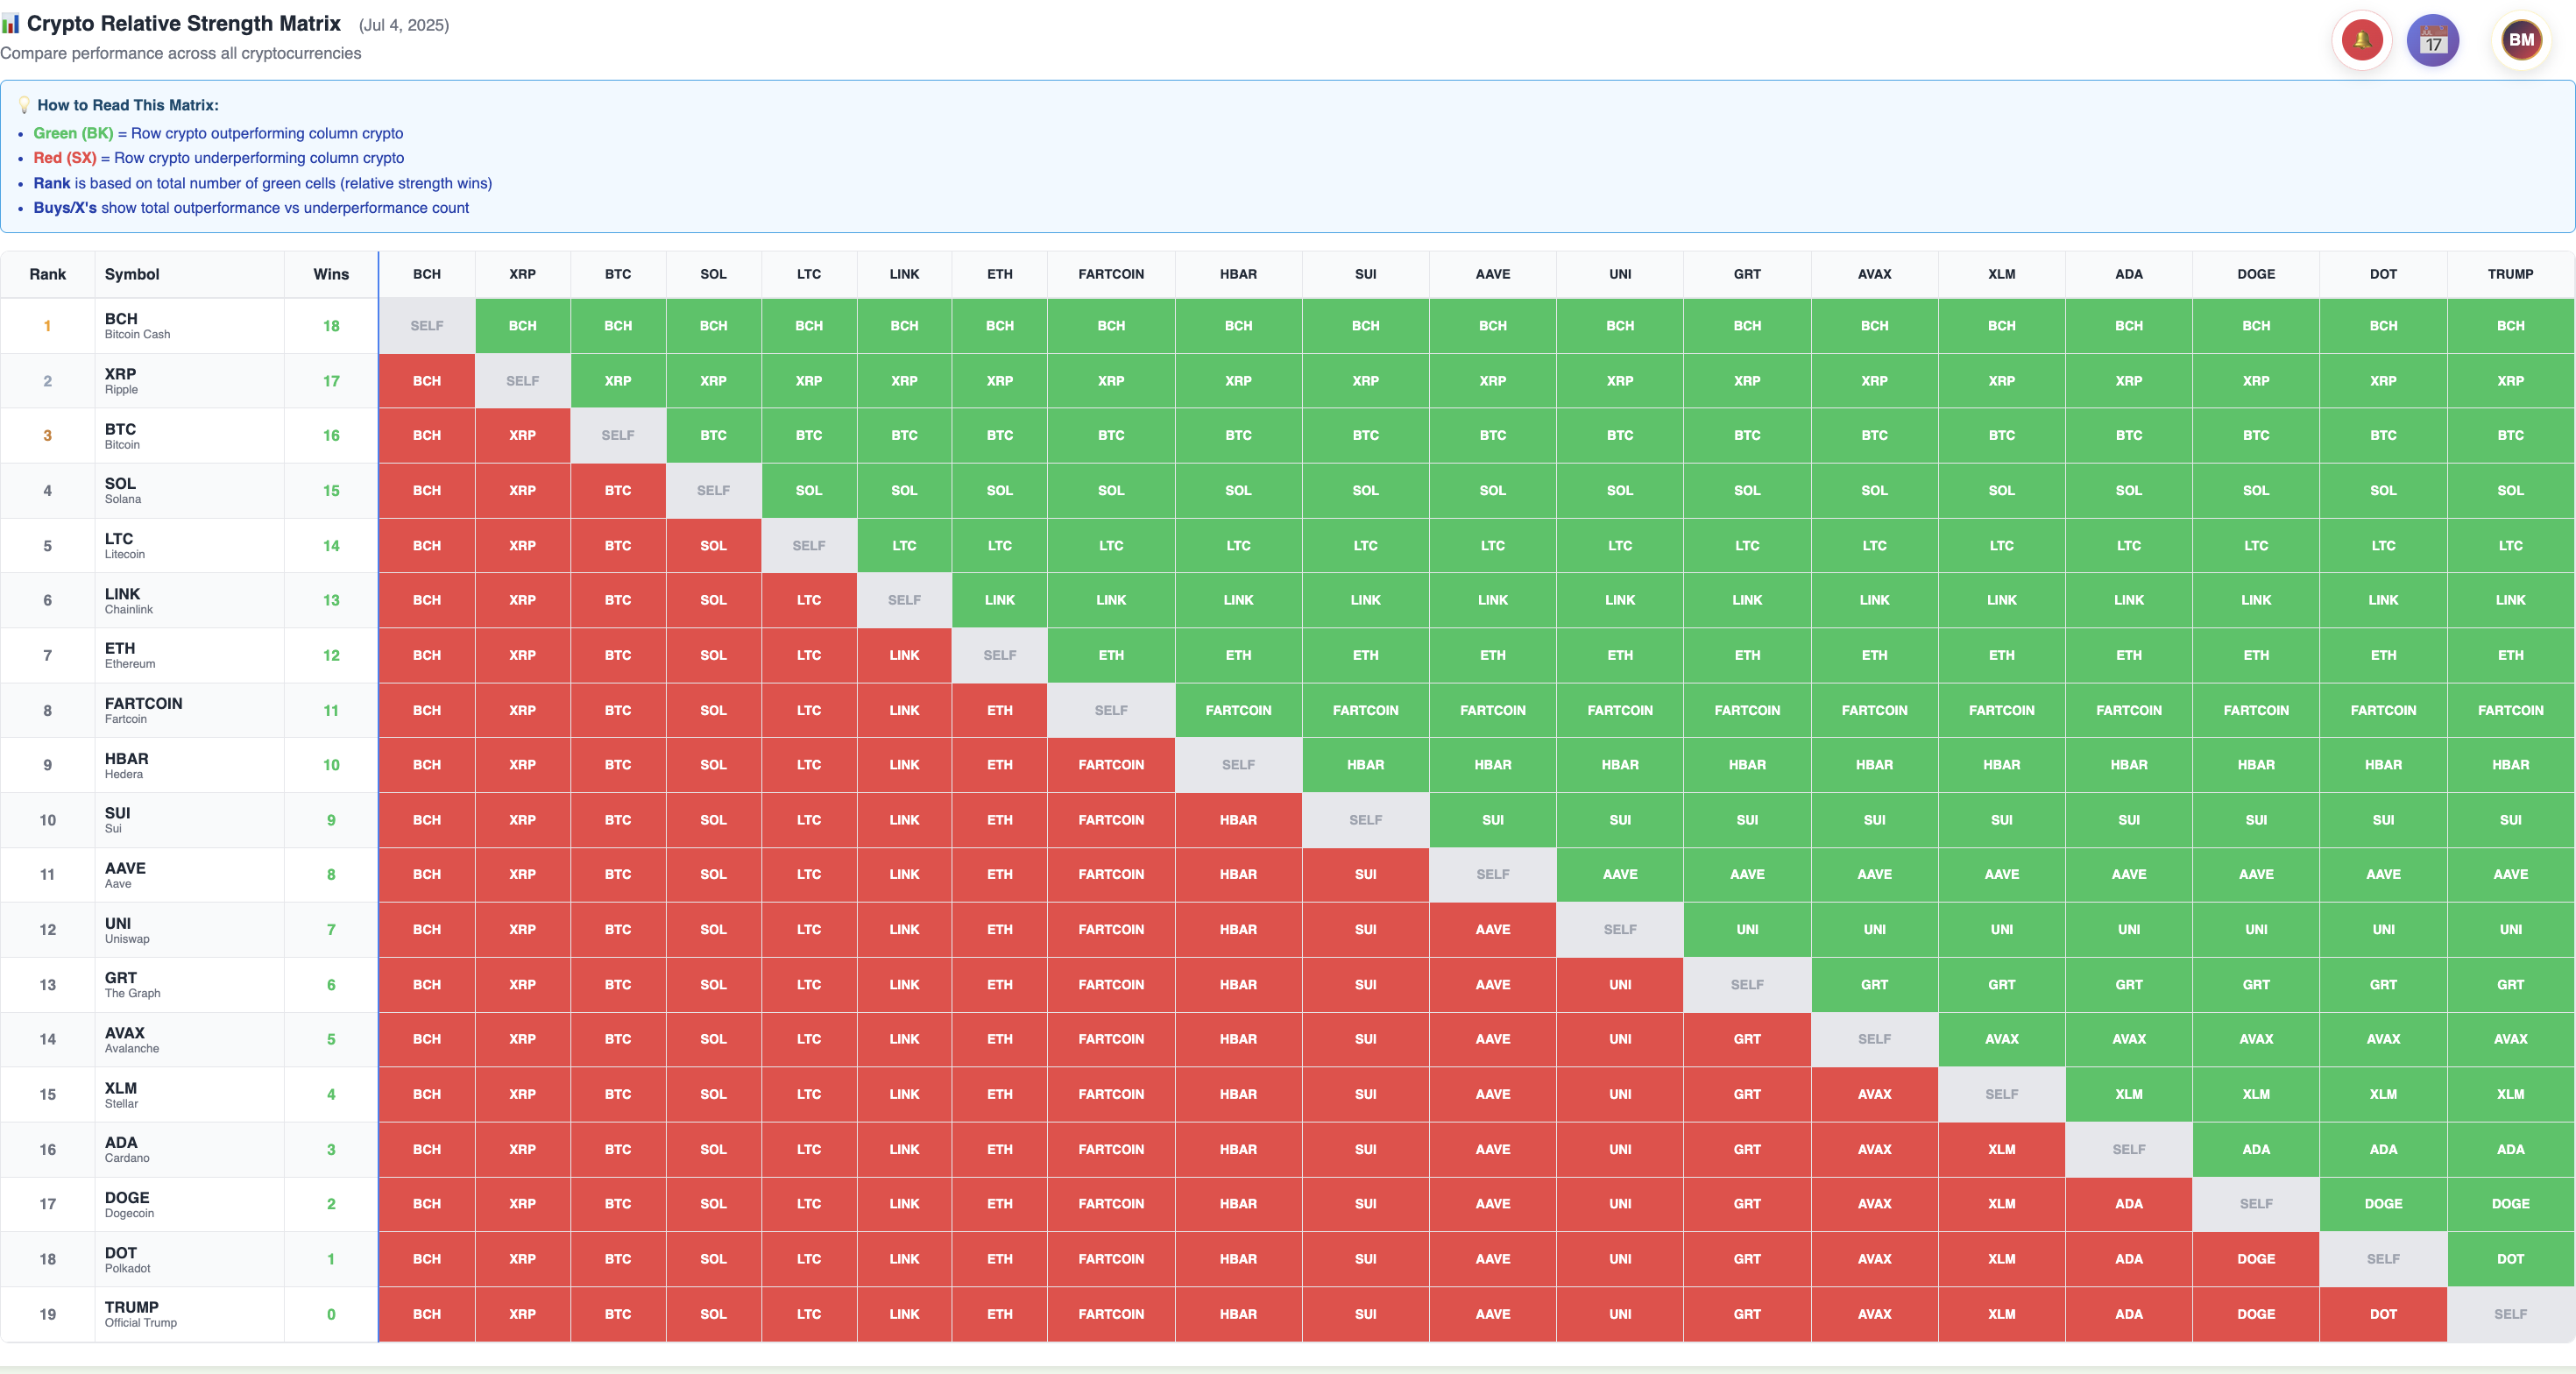
That's what the Relative Strength Matrix does.
It takes each asset and divides it by the others — the simplest, purest test in the world — and lets the numbers choose the winner.
The strong rise. The weak fall. The pretenders get exposed. Every day, without fail.
But here's where it becomes a weapon:
Range position tells you where you are. Sentiment tells you what's building beneath the surface. But relative strength tells you whether that move is real.
If sentiment flips: ➡ Relative strength confirms or denies it.
If price sits at a juicy bottom-range level: ➡ Relative strength tells you if buyers actually showed up.
If a breakout is forming: ➡ Relative strength tells you whether it's a leader or a laggard pretending to lead.
This is how you cut through false signals instantly.
Strong coins follow through. Weak ones fake strength and fade. The matrix tells you which is which — the moment you open the dashboard.
And here's the inevitable truth:
Money always flows to the strongest assets. It always has. It always will.
You can fight that… or you can profit from it.
The Relative Strength Matrix shows you exactly where that flow is going today — so your attention, your trades, and your conviction follow the only thing that actually matters: true strength.
Not hope. Not hype. Not headlines. Strength.
The numbers choose the winners. You simply follow them.
📊 3b. RS Rankings Movement — Watch Strength Shift in Real Time
Knowing who's strong today is powerful. But knowing who's getting stronger — or losing strength — is the real edge.
Because the market doesn't move in snapshots. It moves in waves. In momentum. In shifts of power that begin silently and accelerate suddenly.
Most traders only see the current standings. You'll see the trend.
The RS Rankings Movement tracker shows you exactly how each asset's relative strength ranking has changed over the last 5, 10, 20, 40, and 60 days.
This isn't about price. It's about position.
Is Bitcoin climbing from 15th to 5th in the strength rankings? That's accumulation happening beneath the surface. Institutional money repositioning. A shift happening before the breakout.
Is Ethereum sliding from 3rd to 12th? That's distribution. Weakness masquerading as sideways price action. A warning signal before the fall.
Movement tells you the story price can't.
When you combine this with the RS Matrix, something incredible happens:
You see not just who's strong today, but who's accelerating — the assets gaining momentum across multiple timeframes.
You see not just who's weak today, but who's fading — the assets losing ground even as price pretends to hold.
This is how you spot reversals early. This is how you catch trends before the crowd.
Most traders chase what already moved. You'll see what's about to move — because the strength shift always comes first.
The RS Rankings Movement tracker is your early warning system. Your momentum scanner. Your edge in a market that rewards those who see the shift before it becomes obvious.
Strength changes. Position shifts. You'll know first.
🟩 4. Buy Bottom / Sell Top Levels — The House's Exact Playbook
Most traders love complexity. They stack indicators like ornaments on a Christmas tree — RSI, MACD, clouds, spirals, waves, oscillators, the whole circus.
But complexity is how traders lose.
Professionals don't use noise. They use levels.
Clear. Obvious. Non-negotiable.
Levels tell you the only two things that actually matter: Where to enter. Where to exit.
Everything else is theater.
Imagine walking into a casino and being handed the dealer's rulebook — the exact odds, the exact boundaries, the exact thresholds where the house takes action.
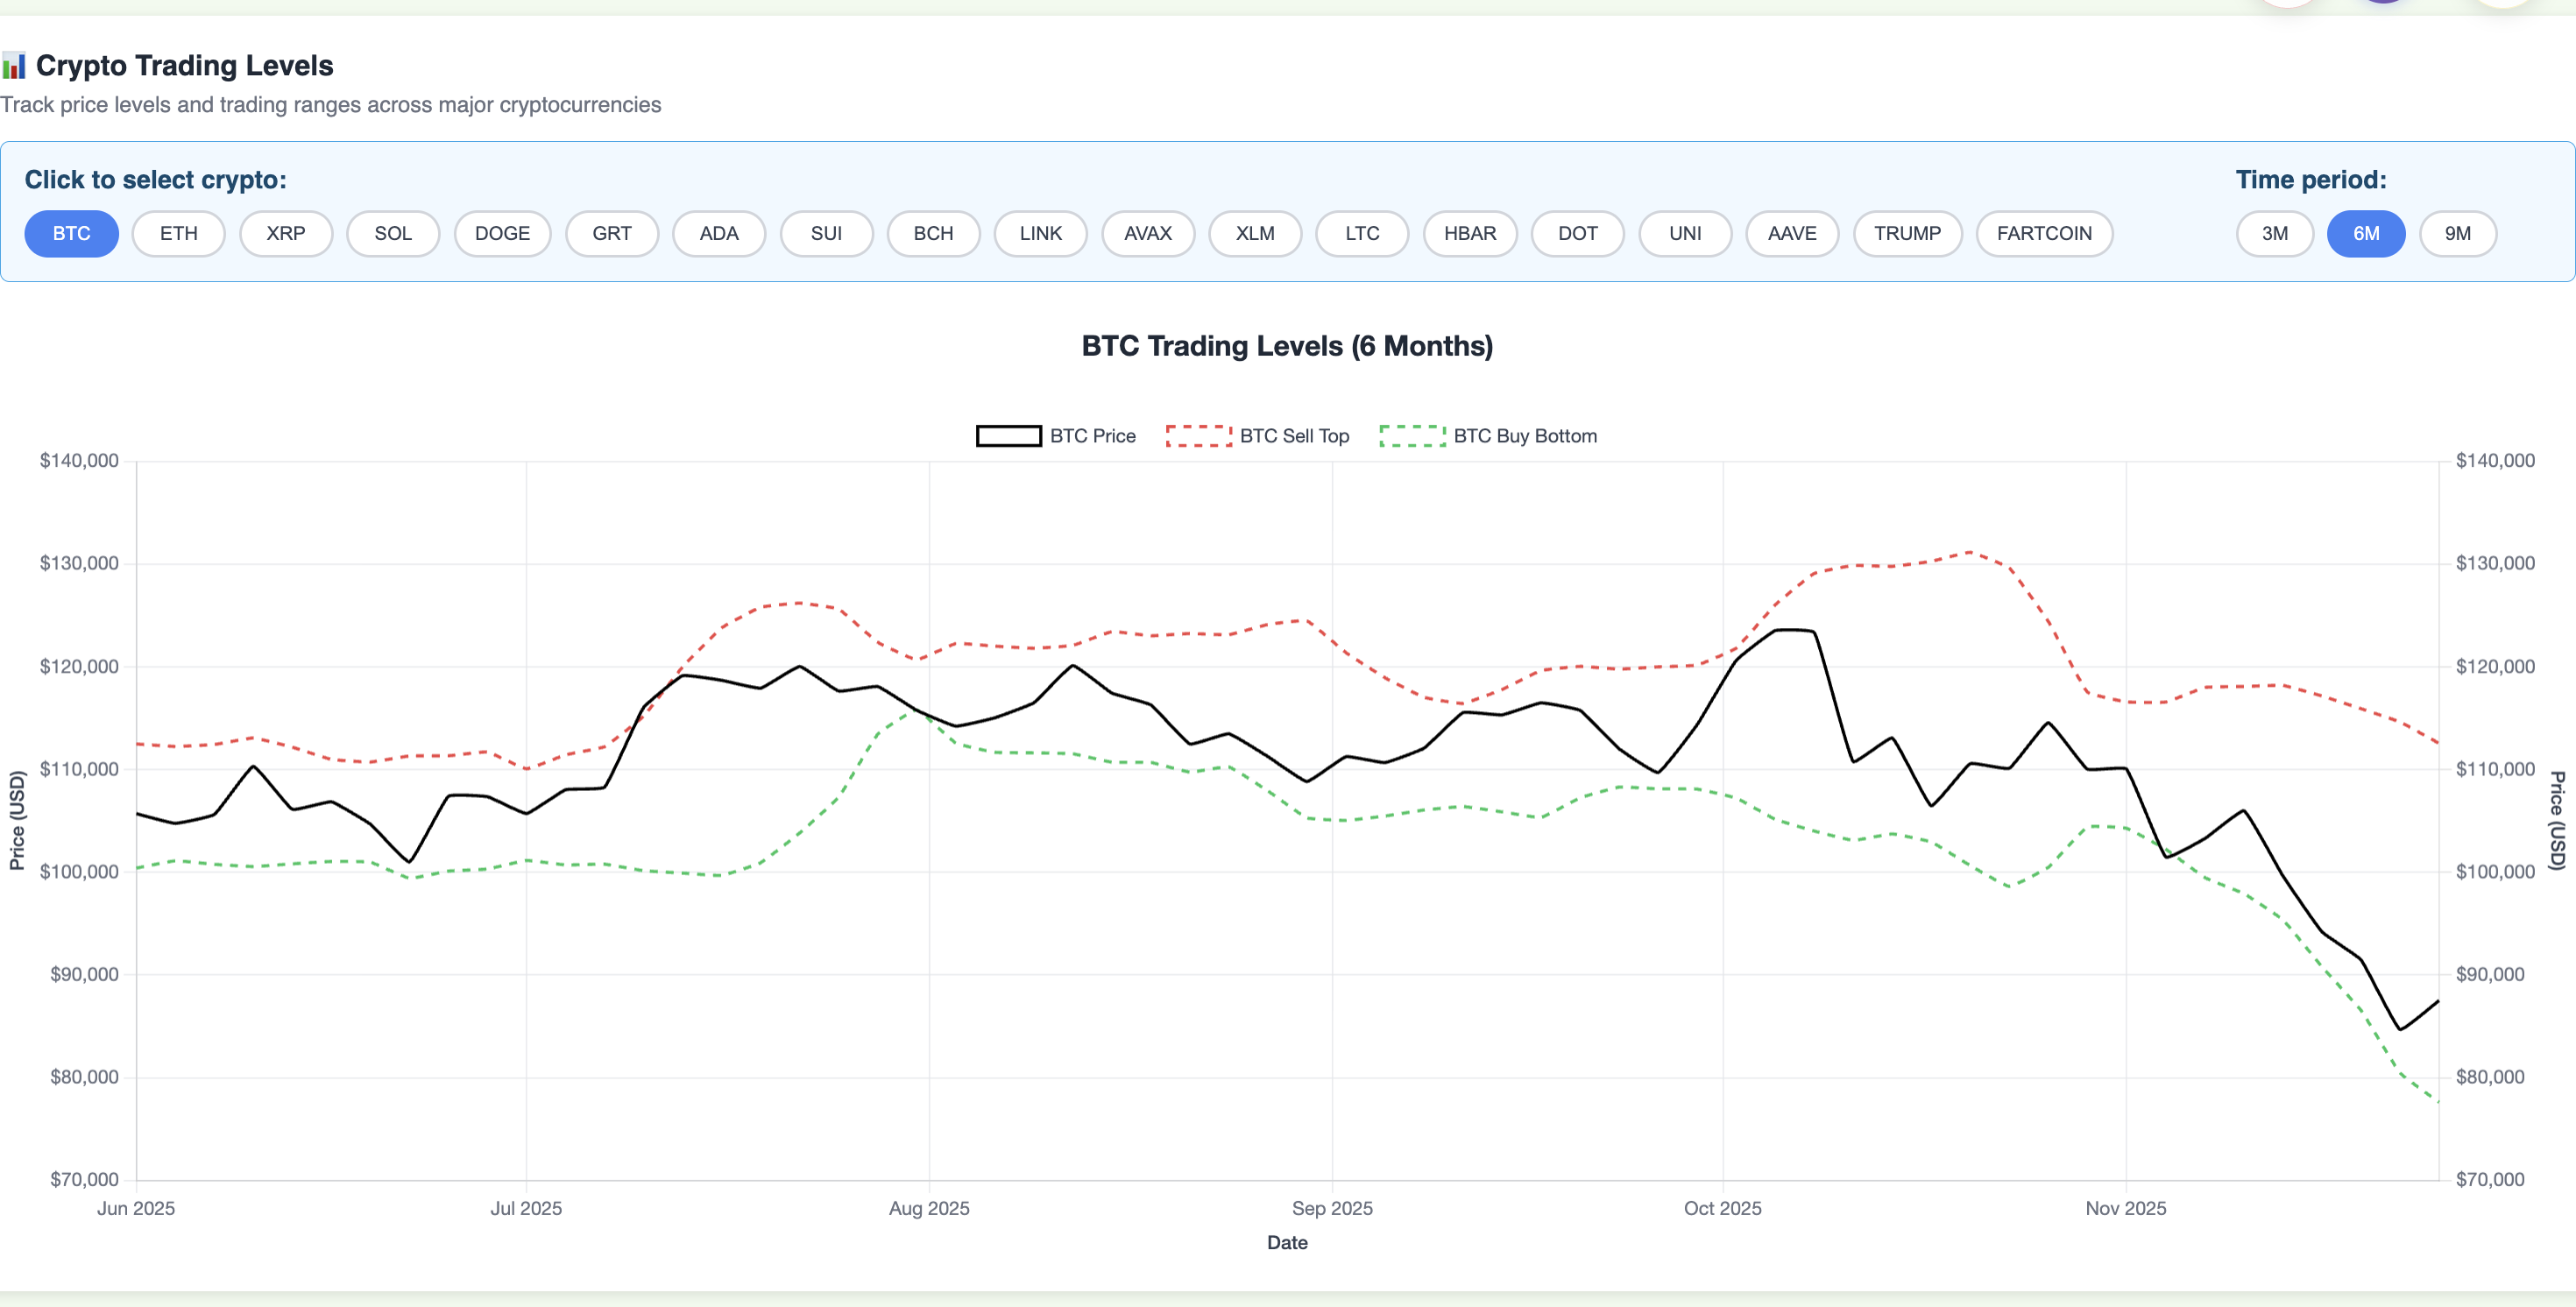
That's what Buy Bottom / Sell Top levels are.
They aren't opinions. They aren't predictions. They aren't "signals."
They are the horizontal laws of the market — the gravitational lines that price reacts to again and again, no matter what narrative is flying across Twitter.
Your daily briefing gives you: The Buy Bottom — where pressure historically flips in your favor • The Sell Top — where rallies fatigue and reversals form • The Trade Level — the equilibrium where the tug-of-war balances • The Trend Lanes — the guardrails of continuation • The Turning Points — the stress fractures before a move • The Breakout Zones — where expansion ignites • The Risk Levels — the no-fly zones that protect your capital
This is the playbook the house uses. This is why they win.
But here's what makes these levels an unfair advantage:
When you combine them with Range Position and Sentiment, the market becomes almost embarrassingly obvious.
A coin at the bottom range with strengthening sentiment? ➡ Buy Bottom confirms the exact entry.
A coin in top range with weakening pressure? ➡ Sell Top shows you where to take profits before everyone else panics.
Sentiment flips bullish? ➡ Levels show exactly where the breakout will take hold.
Range begins to shift upward? ➡ Levels show where the structure will accelerate into trend.
This is precision.
Not vibes. Not indicators. Not guessing. Precision.
Most people wait for the market to tell them what to do. You finally have the lines the market obeys — the boundaries that dictate behavior, the rails price travels on whether retail sees them or not.
This is how the house plays. This is how the house wins. And this is the moment you stop trading with hope… and start trading with precision.
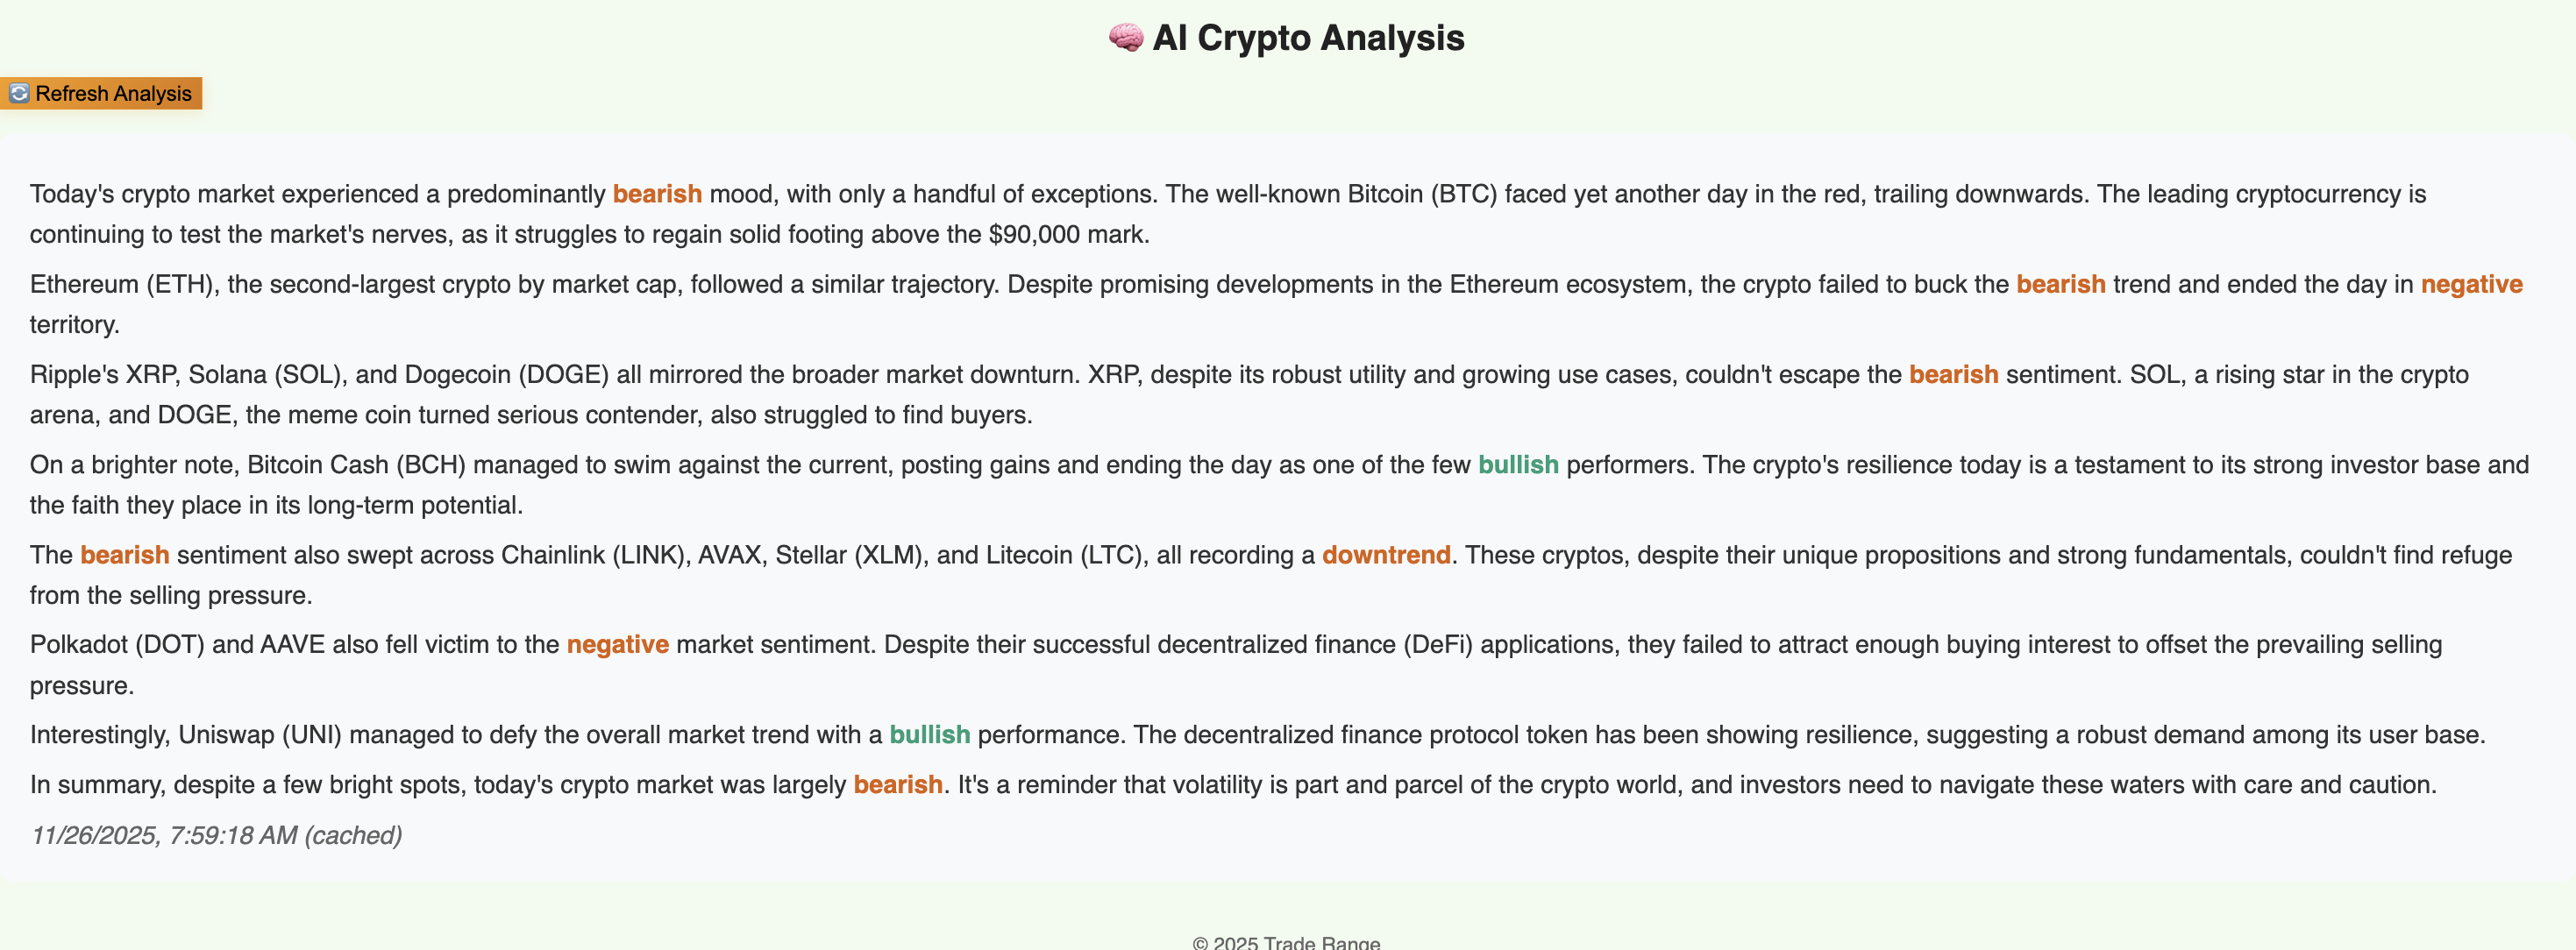
🟪 5. AI Daily Commentary — Your Private Market Interpreter
There are two kinds of traders in crypto:
Those who wake up, open a chart, and try to make sense of the chaos…
…and those who wake up already knowing what changed, why it changed, and what to do next.
The difference? Interpretation.
Anyone can look at a chart. Almost no one can interpret the structure underneath it.
That's what the AI Daily Commentary does.
It reads the market the way a seasoned hedge-fund quant would — with zero emotion, zero bias, and zero hesitation — and delivers the entire story of the market in plain English every morning.
Imagine having someone whisper in your ear the moment you wake up:
"These assets strengthened overnight — pay attention." • "These weakened — be careful." • "This coin is building pressure." • "This one is losing momentum." • "This one is sitting on a structural fault line." • "This one is quietly setting up before anyone notices."
While retail traders are staring at candles, squinting at charts, guessing at narratives, you're reading a briefing that cuts straight through the noise.
No fluff. No hype. Just truth.
The AI isn't predicting the future. It's doing something far more valuable:
It's telling you what actually changed in the market's structure.
Because big moves don't come out of nowhere. They come from: pressure building • strength rotating • ranges shifting • levels tightening • sentiment flipping • leadership changing
All invisible to the naked eye. But not invisible to the system.
Every morning, the AI digests all of it — across all 19 assets — and distills it into a short, sharp, actionable pulse of the market.
It's like having a Wall Street trading desk compressed into a single message delivered to you before you finish your first sip of coffee.
This isn't "analysis." It's not "opinions." It's not those generic newsletters repeating headlines you already saw on Twitter.
It's interpretation.
It's the difference between data… and meaning.
By the time you open the dashboard, you already know: where pressure is building • where danger is rising • which assets deserve attention • which setups are becoming real • which signals matter • which signals are noise • and how the entire market is breathing today
This is the advantage retail never gets. Not until now.
This is the difference between reacting like the gambler… and seeing the structure like the house.
This is the moment everything starts to make sense.
The Trading Decision Pyramid
There's a right order to reading the market. Start at the base, climb the layers — by the time you reach the top, you're making decisions with the same structured view the pros use.
1. Sentiment Distribution
Start with the emotional climate of the market. See where fear, greed, and pressure are building across all assets.
2. Range Position Mapping
Put price inside its structure. Bottom, middle, or top of the range — know whether you're looking at opportunity or danger.
3. Relative Strength Matrix
Compare assets head-to-head. Identify which coins are actually leading and which are quietly fading in the background.

3b. RS Rankings Movement Tracker
Track how each crypto's relative strength ranking has shifted over 5, 10, 20, 40, and 60 days. See which coins are gaining momentum and which are losing steam.
4. Buy Bottom / Sell Top Levels
Turn insight into execution. Get the precise zones where it makes sense to enter, take profits, or step aside.
5. AI Daily Commentary
Let the system translate the structure into plain English so you know what changed, what matters, and where to focus today.
You're no longer guessing — you're making decisions with the same kind of structured view the pros use.
Start Your Free 7-Day Trial💥 Suddenly, Crypto Stops Feeling Random
When you combine sentiment, strength, range, levels, structure, trend, and AI interpretation… you realize something shocking:
Crypto isn't chaotic. It just LOOKS chaotic when you don't have the data.
When you get the data, the chaos becomes a map.
And you finally see why professionals win more consistently than retail traders.
Because they're not playing the same game.
📉 What Happens When You Trade Without This?
- Buying the top of a green candle
- Selling the bottom of a red one
- Getting chopped up in sideways markets
- Panicking at the exact wrong moment
- Hesitating at bottoms
- FOMO buying during hype
- Revenge trading
- Overtrading / undertrading
- Getting in too early
- Getting out too late
Sound familiar? That's the normal retail experience.
Now imagine a world where the market finally makes sense. Where the noise fades away. Where the structure becomes visible. Where your decisions aren't emotional — they're informed.
🔥 What Happens When You Trade WITH This?
Calm replaces chaos
Conviction replaces anxiety
Clarity replaces fear
Structure replaces guessing
You become someone who ACTS early — not late.
You stop feeling like the victim of the market… and start feeling like the one who understands it.
THIS is the unfair advantage.
💎 So What Do You Get as a Subscriber?
Everything we just talked about — every tool, every interpretation, every data advantage — delivered to you every day.
💰 Pricing (And Why It's So Effective)
Most traders lose more than this in a single bad trade.
$30 a month for institutional-level clarity is… well… ridiculous.
But the goal isn't to get rich off subscriptions.
It's to build a tribe of traders who finally trade with context and conviction.
Here's What You Get Every Single Day
Premium subscribers now receive TWO updates per day — morning structure and evening sentiment shift.
You'll always know exactly what changed and what matters.
🧨 Objection Destruction
❌ "I'm not experienced enough."
Perfect. This is built for you. The visuals do the work.
❌ "I've been burned before."
This system prevents emotional mistakes.
❌ "I don't have time."
The AI summary tells you everything in 60 seconds.
❌ "It's too expensive."
One avoided bad trade pays for months.
❌ "I don't get technical analysis."
You don't need to — the levels are already calculated.
❌ "What if I don't like it?"
Cancel anytime. No questions. Zero risk.
❌ "What if the market crashes?"
Even better. When markets fall, structure matters most. You'll know exactly what's breaking, what's bottoming, and what's worth buying — instead of panicking like everyone else.
❌ "I don't want to stare at charts all day."
You won't. TradeRanges tells you the only things that matter — in under 60 seconds. You get the signal, the level, the sentiment, and the strength instantly. Set it and forget it.
🚀 And Now We Come to the Moment
There's a moment in every trader's life when something changes.
When they stop playing the game the way everyone else does.
When they stop making the same emotional mistakes.
When the market finally clicks.
When they stop being the gambler…
…and start becoming the house.
That moment is right now.
Here's What You Get Every Single Day
Premium subscribers now receive TWO updates per day — morning structure and evening sentiment shift.
You'll always know exactly what changed and what matters.
Newsletter Delivery Schedule
7:15 AM
7:15 AM
7:15 AM
7:15 AM
7:15 AM
7:15 AM
7:15 AM
7:15 PM
7:15 PM
7:15 PM
7:15 PM
7:15 PM
7:15 PM
7:15 PM
• Key support/resistance levels
• Volume & sentiment indicators
• Precise buy/sell signals
• Breakouts & reversals
• Updated trade signals
• Tomorrow's setup
14 premium updates every week.
That's 14 chances to make the right move while others are still guessing.
Premium Crypto Dashboard Experience
Make Informed Decisions with Professional-Grade Crypto Analysis
Premium subscribers gain access to our complete crypto dashboard with color-coded indicators, precise buy/sell levels, and sentiment analysis for all major cryptocurrencies.
Clearly defined Buy Bottom and Sell Top levels for optimal entry and exit points
Bullish/Bearish indicators based on technical patterns and market activity
Color-coded volume and price indicators show market strength at a glance
Subscribers receive this complete analysis twice daily at 7:15 AM & 7:15 PM ET,
helping you stay ahead of market movements.